Are language models good at making predictions?
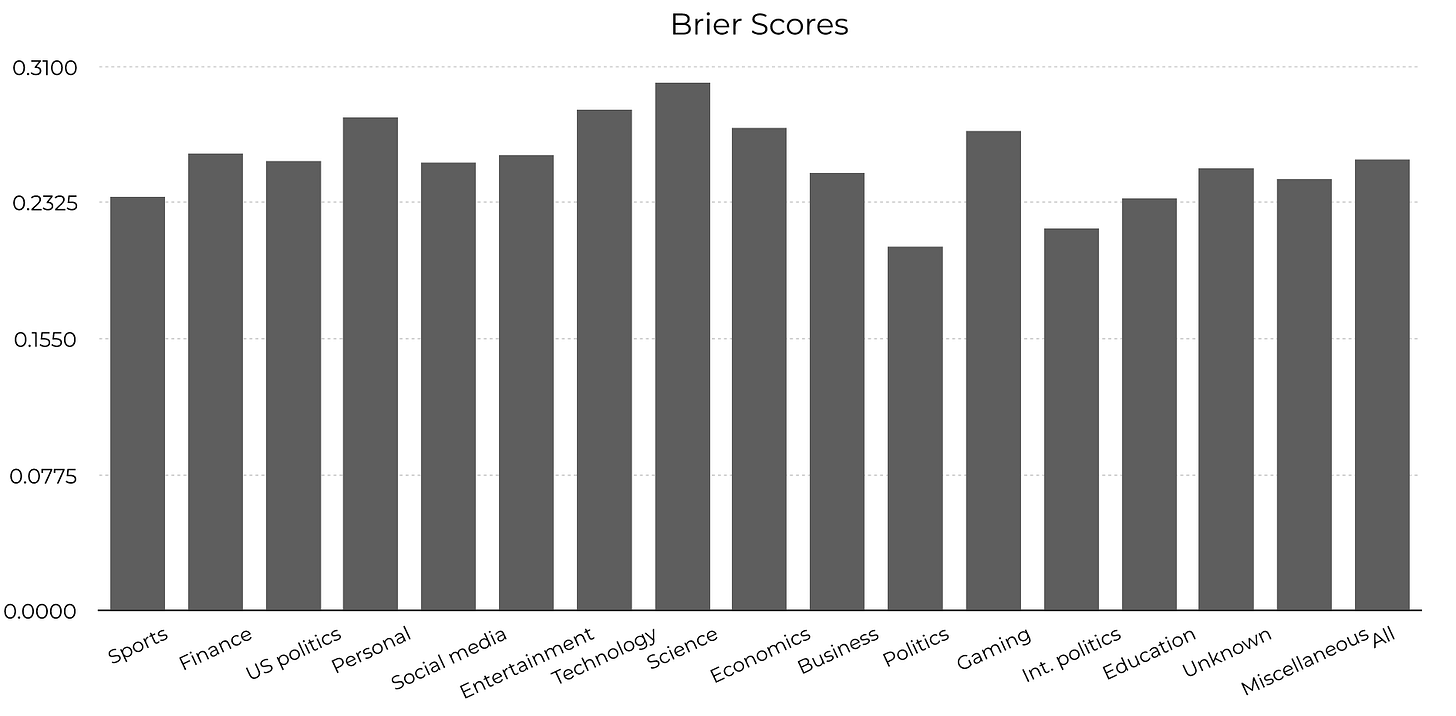
politics more than science
To get a crude answer to this question, we took 5000 questions from Manifold markets that were resolved after GPT-4’s current knowledge cutoff of Jan 1, 2022. We gave the text of each of them to GPT-4, along with these instructions:
You are an expert superforecaster, familiar with the work of Tetlock and others. For each question in the following json block, make a prediction of the probability that the question will be resolved as true.
Also you must determine category of the question. Some examples include: Sports, American politics, Science etc. Use make_predictions function to record your decisions. You MUST give a probability estimate between 0 and 1 UNDER ALL CIRCUMSTANCES. If for some reason you can’t answer, pick the base rate, but return a number between 0 and 1.
This produced a big table:
In retrospect maybe we have filtered these. Many questions are a bit silly for our purposes, though they’re typically classified as “Test”, “Uncategorized”, or “Personal”.
Is this good?
One way to measure if you’re good at predicting stuff is to check your calibration: When you say something has a 30% probability, does it actually happen 30% of the time?
To check this, you need to make a lot of predictions. Then you dump all your 30% predictions together, and see how many of them happened.
GPT-4 is not well-calibrated.
Here, the x-axis is the range of probabilities GPT-4 gave, broken down into bins of size 5%. For each bin, the green line shows how often those things actually happened. Ideally, this would match the dotted black line. For reference, the bars show how many predictions GPT-4 gave that fell into each of the bins. (The lines are labeled on the y-axis on the left, while the bars are labeled on the y-axis on the right.)
At a high level, this means that GPT-4 is over-confident. When it says something has only a 20% chance of happening, actually happens around 35-40% of the time. When it says something has an 80% chance of happening, it only happens around 60-75% of the time.
Does it depend on the area?
We can make the same plot for each of the 16 categories. (Remember, these categories were decided by GPT-4, though from a spot-check, they look accurate.) For unclear reasons, GPT-4 is well-calibrated for questions on sports, but horrendously calibrated for “personal” questions:
All the lines look a bit noisy since there are 20 × 4 × 4 = 320 total bins and only 5000 total observations.
Is there more to life than calibration?
Say you and I are predicting the outcome that a fair coin comes up heads when flipped. I always predict 50%, while you always predict either 0% or 100% and you’re always right. Then we are both perfectly calibrated. But clearly your predictions are better, because you predicted with more confidence.
The typical way to deal with this is squared errors, or “Brier scores”. To calculate this, let the actual outcome be 1 if the thing happened, and 0 if it didn’t. Then take the average squared difference between your probability and the actual outcome. For example:
GPT-4 gave “Will SBF make a tweet before Dec 31, 2022 11:59pm ET?” a YES probability of 0.9. Since this actually happened, this corresponds to a score of (0.9-1)² = 0.01.
GPT-4 gave “Will Manifold display the amount a market has been tipped by end of September?” a YES probability of 0.6. Since this didn’t happen, this corresponds to a score of (0.6-0)² = 0.36.
Here are the average scores for each category (lower is better):
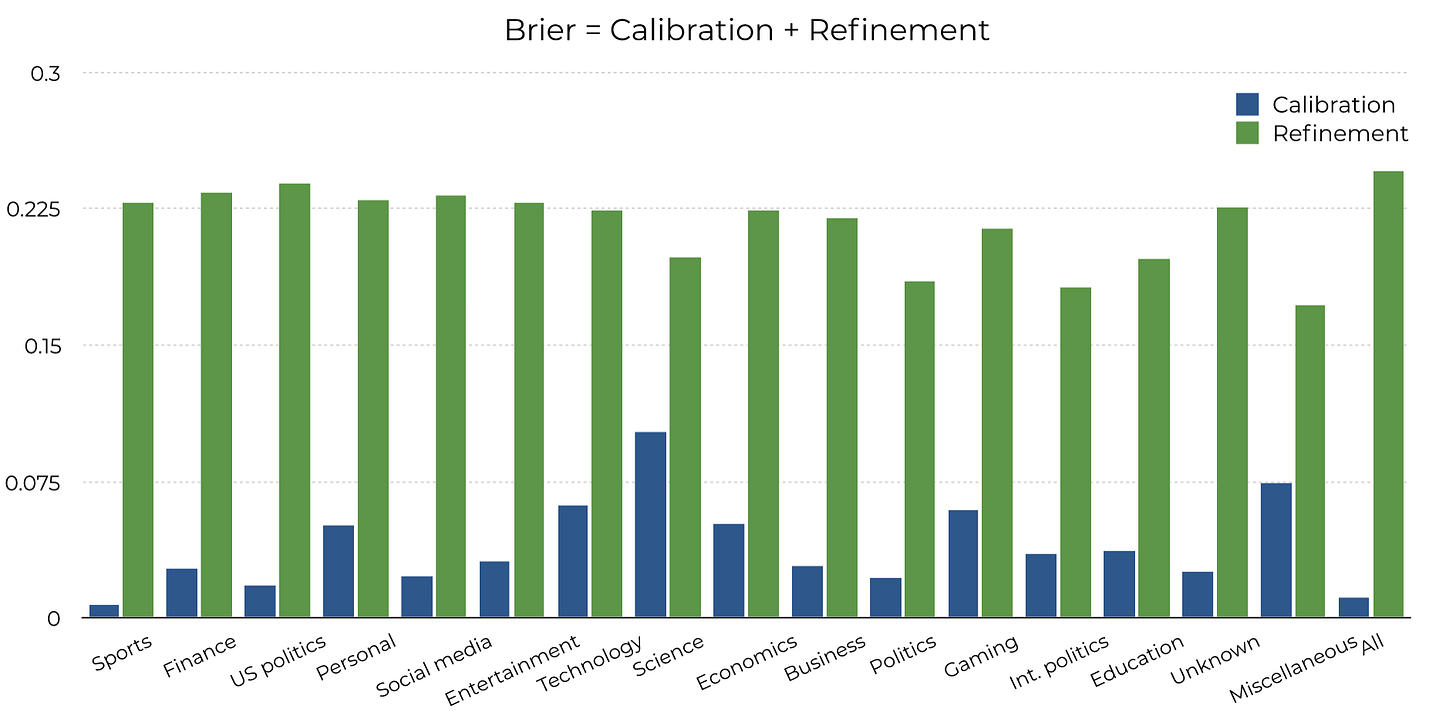
Or, if you want, you can decompose the Brier score. There are various ways to do this, but my favorite is Brier = Calibration + Refinement. Informally, Calibration is how close the green lines above are to the dotted black lines, while Refinement is how confident you were. (Both are better when smaller.)
You can also visualize this as a scatterplot:
Is there more to life than refinement?
Brier scores are better for politics questions than for science questions. But is that because it’s bad at science, or just because science questions are hard?
There’s a way to further decompose the Brier score. You can break up the resolution as Refinement = Uncertainty - Resolution. Roughly speaking, Uncertainty is “how hard questions are”, while Resolution is “how confident you were, once calibration and uncertainty are accounted for”.
Here’s the uncertainty for different categories:
And here’s a scatterplot of the calibration and resolution for each category: (Since more resolution is better, it’s now the upper-left that contains better predictions.)
Overall, this further decomposition doesn’t change much. This suggests GPT-4 really is better at making predictions for politics than for science or technology, even once the hardness of the questions are accounted for.
P.S. The relative merits of different Brier score decompositions caused an amazing amount of internal strife during the making of this post. I had no idea I could feel so strongly about mundane technical choices. I guess I now have an exciting new category of enemies.


Politicians are effectively large language models: they are rewarded for sounded correct, not for producing real outcomes. So maybe that’s why political outcomes are easier for it to predict?
Post hoc observation: of course ChatGPT does better with political predictions. It is a wordcel after all