

Heritability of human life span is about 50% when heritability is redefined to be something different
Ratios will be ratios

How heritable is hair color? Well, if you’re a redhead and you have an identical twin, they will definitely also be a redhead. But the age at which twins go gray seems to vary a bit based on lifestyle. And there’s some randomness in where melanocytes end up on your skull when you’re an embryo. And your twin might dye their hair! So the correct answer is, some large number, but less than 100%.
OK, but check this out: Say I redefine “hair color” to mean “hair color except ignoring epigenetic and embryonic stuff and pretending that no one ever goes gray or dyes their hair et cetera”. Now, hair color is 100% heritable. Amazing, right?
Or—how heritable is IQ? The wise man answers, “Some number between 0% or 100%, it’s not that important, please don’t yell at me.” But whatever the number is, it depends on society. In our branch of the multiverse, some kids get private tutors and organic food and $20,000 summer camps, while other kids get dysfunctional schools and lead paint and summers spent drinking Pepsi and staring at glowing rectangles. These things surely have at least some impact on IQ.
But again, watch this: Say I redefine “IQ” to be “IQ in some hypothetical world where every kid got exactly the same school, nutrition, and parenting, so none of those non-genetic factors matter anymore.” Suddenly, the heritability of IQ is higher. Thrilling, right? So much science.
If you want to redefine stuff like this… that’s not wrong. I mean, heritability is a pretty arbitrary concept to start with. So if you prefer to talk about heritability in some other world instead of our actual world, who am I to judge?
Incidentally, here’s a recent paper:
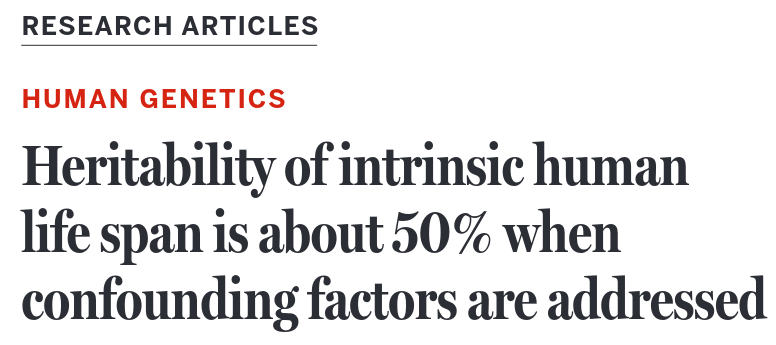
I STRESS THAT THIS IS A PERFECTLY FINE PAPER. I’m picking on it mostly because it was published in Science, meaning—like all Science papers—it makes grand claims but is woefully vague about what those claims mean or what was actually done. Also, publishing in Science is morally wrong and/or makes me envious. So I thought I’d try to explain what’s happening.
It’s actually pretty simple. At least, now that I’ve spent several hours reading the paper and its appendix over and over again, I’ve now convinced myself that it’s pretty simple. So, as a little pedagogical experiment, I’m going to try to explain the paper three times, with varying levels of detail.
Explanation 1: The very extremely high level picture
The normal way to estimate the heritability of lifespan is using twin data. Depending on what dataset you use, this will give 23-35%. This paper built a mathematical model that tries to simulate how long people would live in a hypothetical world in which no one dies from any non-aging related cause, meaning no car accidents, no drug overdoses, no suicides, no murders, and no (non-age-related) infectious disease. On that simulated data, for simulated people in a hypothetical world, heritability was 46-57%.
Commentary
Everyone seems to be interpreting this paper as follows:
Aha! We thought the heritability of lifespan was 23-35%. But it turns out that it’s around 50%. Now we know!
I understand this. Clearly, when the editors at Science chose the title for this paper, their goal was to lead you to that conclusion. But this is not what the paper says. What it says is this:
We built a mathematical model of alternate universe in which nobody died from accidents, murder, drug overdoses, or infectious disease. In that model, heritability was about 50%.
Explanation 2: The very high-level picture
Let’s start over. Here’s figure 2 from the paper.
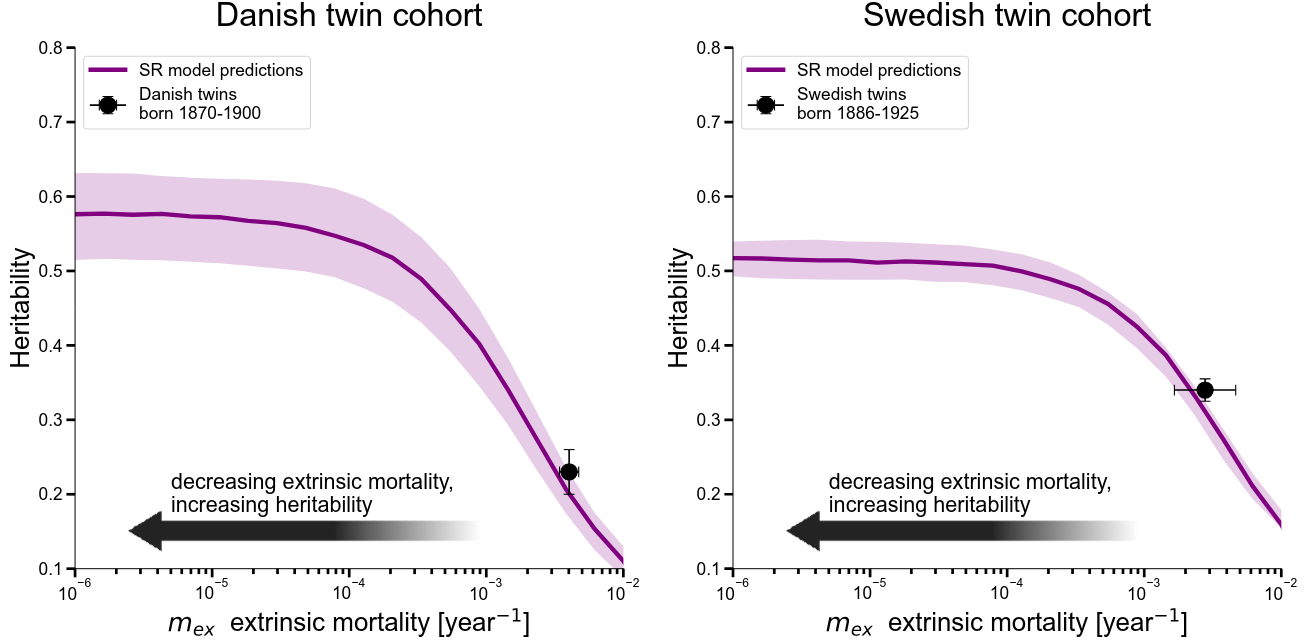
Normally, heritability is estimated from twin studies. The idea is that identical twins share 100% of their DNA, while fraternal twins share only 50%. So if some trait is more correlated among identical twins than among fraternal twins, that suggests DNA influences that trait. There are statistics that formalize this intuition. Given a dataset that records how long various identical and fraternal twins lived, these produce a heritability number.
Two such traditional estimates appear as black circles in the above figures. For the Danish twin cohort, lifespan is estimated to be 23% heritable. For the Swedish cohort, it’s 35%.
This paper makes a “twin simulator”. Given historical data, they fit a mathematical model to simulate the lifespans of “new” twins. Then they compute heritability on this simulated data.
Why calculate heritability on simulated data instead of real data? Well, their mathematical model contains an “extrinsic mortality” parameter, which is supposed to reflect the chance of death due to all non-aging-related factors like accidents, murder, or infectious disease. They assume that the chance someone dies from any of this stuff is constant over people, constant over time, and that it accounts for almost all deaths for people aged between 15 and 40.
The point of building the simulator is that it’s possible to change extrinsic mortality. That’s what’s happening in the purple curves in the above figure. For a range of different extrinsic mortality parameters, they simulate datasets of twins. For each simulated dataset, they estimate heritability just like with a real dataset.
Note that the purple curves above nearly hit the black circles. This means that if they run their simulator with extrinsic mortality set to match reality, they get heritability numbers that line up with what we get from real data. That suggests their mathematical model isn’t totally insane.
If you decrease extrinsic mortality, then you decrease the non-genetic randomness in how long people live. So heritability goes up. Hence, the purple curves go up as you go to the left.
Intermission: On Science
My explanation of this paper relies on some amount of guesswork. For whatever reason, Science has decided that papers should contain almost no math, even when the paper in question is about math. So I’m mostly working from an English description. But even that description isn’t systematic. There’s no place that clearly lays out all the things they did, in order. Instead, you get little hints, sort of randomly distributed throughout the paper. There’s an appendix, which the paper confidently cites over and over. But if you actually read the appendix, it’s just more disconnected explanations of random things except now with equations set in glorious Microsoft Word format.
Now, in most journals, authors write everything. But Science has professional editors. Given that every single statistics-focused paper in Science seems to be like this, we probably shouldn’t blame the authors of this one. (Other than for their decision to publish in Science in the first place.)
I do wonder what those editors are doing, though. I mean, let me show you something. Here’s the first paragraph where they start to actually explain what they actually did, from the first page:
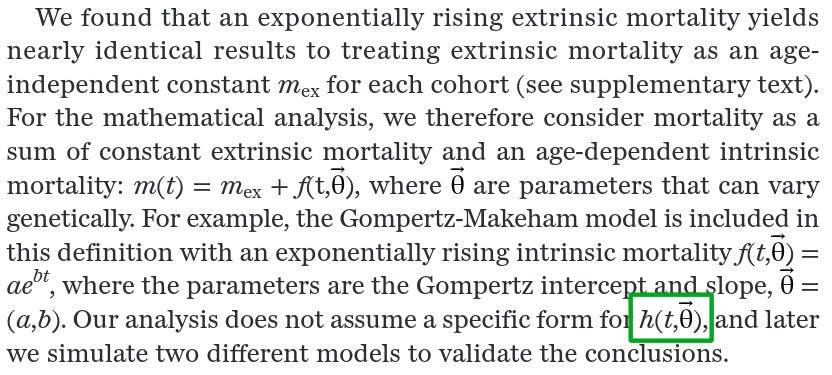
See that h(t,θ) at the end? What the hell is that, you ask? That’s a good question, because it was never introduced before this and is never mentioned again. I guess it’s just supposed to be f(t,θ), which is fine. (I yield to none in my production of typos.) But if paying journals ungodly amounts of money brought us to this, of what use are those journals?
Moving on…
Explanation 3: Also pretty high level, but as low as we’re doing to go
Probably most people don’t need this much detail and should skip this section. For everyone else, let’s start over one last time.
The “normal” way to estimate heritability is by looking at correlations between different kinds of twins. Intuitively, if the lifespans of identical twins are more correlated than the lifespans of fraternal twins, that suggests lifespan is heritable. And it turns out that one estimator for heritability is “twice the difference between the correlation among identical twins and the correlation among fraternal twins, all raised together.” There are other similar estimators for other kinds of twins. These normally say lifespan is perhaps 20% and 35% heritable.
This paper created an equation to model the probability a given person will die at a given age. The parameters of the equation vary from person to person, reflecting that some of us have DNA that predisposes us to live longer than others. But the idea is that the chances of dying are fairly constant between the ages of 15 and 40, after which they start increasing.
This equation contains an “extrinsic mortality” parameter. This is meant to reflect the chance of death due to all non-aging related factors like accidents or murder, etc. They assume this is constant. (Constant with respect to people and constant over time.) Note that they don’t actually look at any data on causes of death. They just add a constant risk of death that’s shared by all people at all ages to the equation, and then they call this “extrinsic mortality”.
Now remember, different people are supposed to have different parameters in their probability-of-death equations. To reflect this, they fit a Gaussian distribution (bell curve) to the parameters with the goal of making it fit with historical data. The idea is that if the distribution over parameters were too broad, you might get lots of people dying at 15 or living until 120, which would be wrong. If the distribution were too concentrated, then you might get everyone dying at 43, which would also be wrong. So they find a good distribution, one that makes the ages people die in simulation look like the ages people actually died in historical data.
Right! So now they have:
An equation that’s supposed to reflect the probability a given person dies at a given age.
A distribution over the parameters of that equation that’s supposed to produce population-wide death ages that look like those in real historical data.
Before moving on, I remind you of two things:
They assume their death equation entirely determines the probability someone will die in a given year.
They assume that the shape of someone’s death equation is entirely determined by genetics.
The event of a person dying at a given age is random. But the probability that this happens is assumed to be fixed and determined by genes and genes alone.
Now they simulate different kinds of twins. To simulate identical twins, they just draw parameters from their parameter distribution, assign those parameters to two different people, and then let them randomly die according to their death equation. (Is this getting morbid?) To simulate fraternal twins, they do the same thing, except instead of giving the two twins identical parameters, they give them correlated parameters, to reflect that they share 50% of their DNA.
How exactly do they create those correlated parameters? They don’t explain this in the paper, and they’re quite vague in the supplement. As far as I can tell they sample two sets of parameters from their parameter distribution such that the parameters are correlated at a level of 0.5.
Now they have simulated twins. They can simulate them with different extrinsic mortality values. If they lower extrinsic mortality, heritability of lifespan goes up. If they lower it to zero, heritability goes up to around 50%.
More commentary
Almost all human traits are partly genetic and partly due to the environment and/or random. If you could change the world and reduce the amount of randomness, then of course heritability would go up. That’s true for life expectancy just life for anything else. So what’s the point of this paper?
There is a point!
Sure, obviously heritability would be higher in a world without accidents or murder. We don’t need a paper to know that. But how much higher? It’s impossible to say without modeling and simulating that other world.
Our twin datasets are really old. It’s likely that non-aging-related deaths are lower now in the past, because we have better healthcare and so on. This means that the heritability of lifespan for people alive today may be larger than it was for the people in our twin datasets, some of whom were born in 1870. We won’t know for sure until we’re all dead, but this paper gives us a way to guess.
Have I mentioned that heritability depends on society? And that heritability changes when society changes? And that heritability is just a ratio and you should stop trying to make it be a non-ratio because only-ratio things cannot be non-ratios? This is a nice reminder.
Honestly, I think the model the paper built is quite clever. Nothing is perfect, but I think this is a pretty good run at the question of, “How high would the heritability of lifespan be if extrinsic mortality were lower?”
I only have two objections. The first is to the Science writing style. This is a paper describing a statistical model. So shouldn’t there be somewhere in the paper where they explain exactly what they did, in order, from start to finish? Ostensibly, I think this is done in the left-hand column on the second page, just with little detail because Science is written for a general audience. But personally I think that description is the worst of all worlds. Instead of giving the high-level story in a coherent way, it throws random technical details at you without enough information to actually make sense of them. Couldn’t the full story with the full details at least be in the appendix? I feel like this wasted hours of my time, and that if someone wanted to reproduce this work, they would have almost no chance of doing so from the description given. How have we as a society decided that we should take our “best” papers and do this to them?
But my main objection is this:
At first, I thought this was absurd. The fact that people die in car accidents is not a “confounding factor”. And pretending that no one dies in a car accidents does not “address” some kind of bias. That’s just computing heritability in some other world. Remember, heritability is not some kind of Platonic form. It is an observational statistic. There is no such thing as “true” heritability, independent of the contingent facts of our world.
But upon reflection, I think they’re trying to say something like this:
Heritability of human lifespan is about 50% when extrinsic mortality is adjusted to be closer to modern levels.
The problem is: I think this is… not true? Here are the actual heritability estimates in the paper, varying by dataset (different plots) the cutoff year (colors) and extrinsic mortality (x-axis).
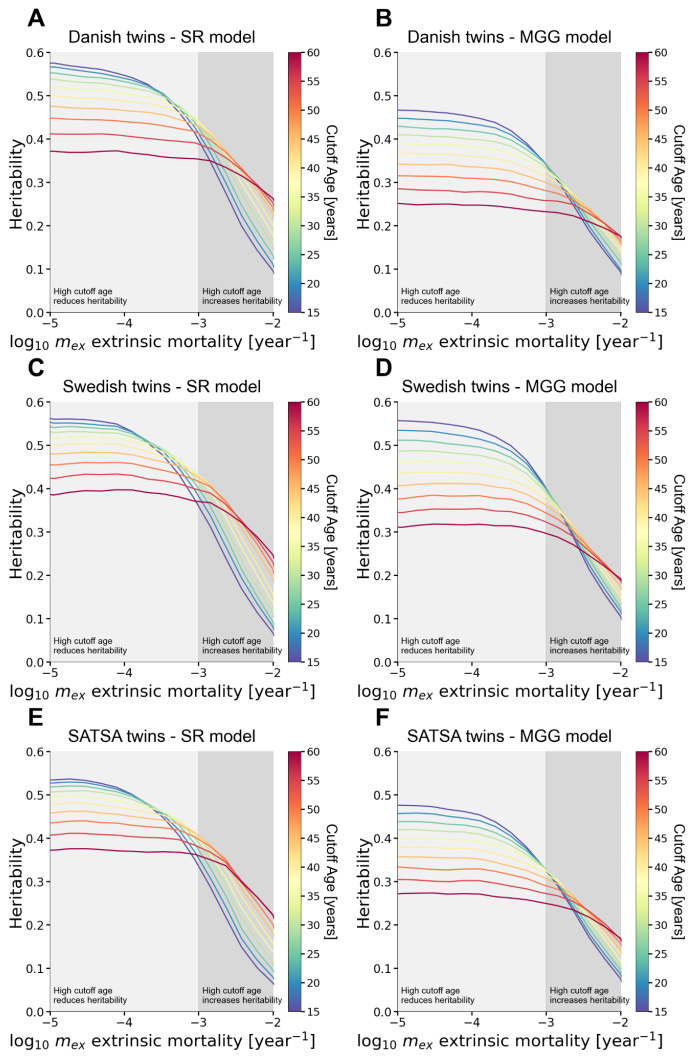
When extrinsic mortality goes down, heritability goes up. So the obvious question is: What is extrinsic mortality in modern people?
This is a tricky question, because “extrinsic mortality” isn’t some simple observational statistic. It is a parameter in their model. (Remember, they never looked at causes of death.) So it’s hard to say, but they seem to suggest that extrinsic mortality in modern people is 0.001 / year, or perhaps a bit less.
The above figures have the base-10 logarithm of extrinsic mortality on the x-axis. And the base-10 logarithm of 0.001 is -3. But if you look at the curves when the x-axis is -3, the heritability estimates are not 50%. They’re more like 35-45%, depending on the particular model and age cutoff.
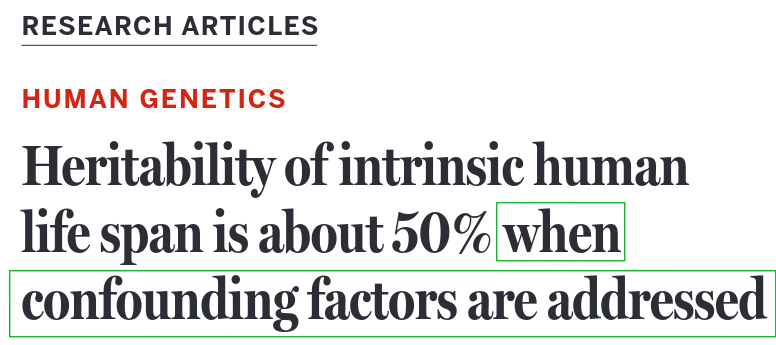
So here’s my suggested title:
Heritability of human lifespan is about 40% when extrinsic mortality is adjusted to modern levels, according to our simulation.
There might be a reason I don’t work at Science.
when I was in grad school the joke went "articles in JBC are always right and occasionally interesting, while articles in Cell are always interesting and occasionally right"
Journal of Biological Chemistry is boring and full of graphs, while Cell has fun full-color pics
> The first is to the Science writing style. This is a paper describing a statistical model. So shouldn’t there be somewhere in the paper where they explain exactly what they did, in order, from start to finish? Ostensibly, I think this is done in the left-hand column on the second page, just with little detail because Science is written for a general audience. But personally I think that description is the worst of all worlds. Instead of giving the high-level story in a coherent way, it throws random technical details at you without enough information to actually make sense of them.
This is generally how a lot of computational science articles are written. It drove a lot of my colleagues nuts because they are like, "Can you describe everything you did?" Statisticians cannot understand the statistical methods sections of most papers, me included.